


1.完整项目描述和程序获取
>面包多安全交易平台:https://mbd.pub/o/bread/ZJeWkphr
>如果链接失效,可以直接打开本站店铺搜索相关店铺:
>如果链接失效,程序调试报错或者项目合作也可以加微信或者QQ联系。
2.部分仿真图预览
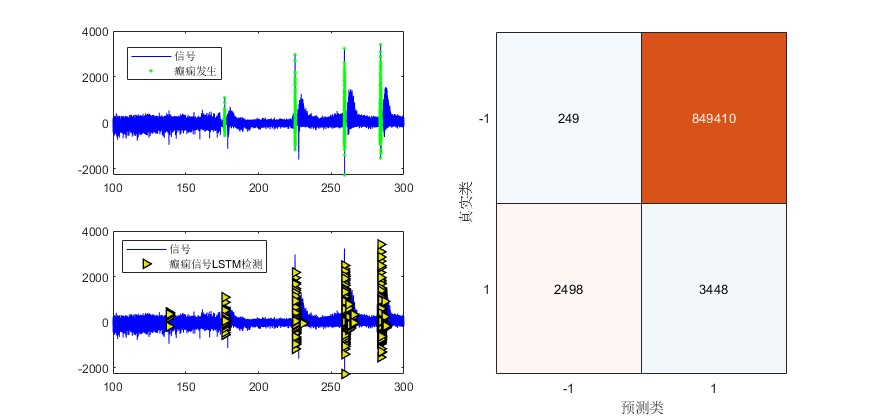
3.算法概述
LSTM是一种含有LSTM区块(blocks)或其他的一种类神经网络,文献或其他资料中LSTM区块可能被描述成智能网络单元,因为它可以记忆不定时间长度的数值,区块中有一个gate能够决定input是否重要到能被记住及能不能被输出output。图1底下是四个S函数单元,最左边函数依情况可能成为区块的input,右边三个会经过gate决定input是否能传入区块,左边第二个为input gate,如果这里产出近似于零,将把这里的值挡住,不会进到下一层。左边第三个是forget gate,当这产生值近似于零,将把区块里记住的值忘掉。第四个也就是最右边的input为output gate,他可以决定在区块记忆中的input是否能输出 。
4.部分源码
.................................................
%Classify
YPred = classify(net,channel)';
YPred_numerical = double(YPred);
YPred_numerical(YPred_numerical==1)= 1;
YPred_numerical(YPred_numerical==2)=-1;
acc = sum(YPred == output)./numel(output)
%Time
timepoint = 300/length(output);
time = [timepoint:timepoint:timepoint*length(output)];
figure
subplot(221)
plot(time, channel, 'b')
hold on
plot(time(channel_out==1),channel(channel_out==1), '.g')
legend('信号', '癫痫发生')
xlim([100,300])
subplot(223)
plot(time, channel, 'b')
hold on
plot(time(YPred=='1'),channel(YPred=='1'),'r>',...
'LineWidth',1,...
'MarkerSize',6,...
'MarkerEdgeColor','k',...
'MarkerFaceColor',[0.9,0.9,0.0]);
legend('信号', '癫痫信号LSTM检测')
xlim([100,300])
subplot(2,2,[2,4])
confusionchart(channel_out,YPred_numerical)
a917