


1.������Ŀ�����ͳ����ȡ
>����లȫ����ƽ̨:https://mbd.pub/o/bread/ZJeYmZZp
>�������ʧЧ������ֱ�Ӵ�վ����������ص��̣�
>�������ʧЧ��������Ա���������Ŀ����Ҳ���Լ��Ż���QQ��ϵ��
2.���ַ���ͼԤ��
3.�㷨����
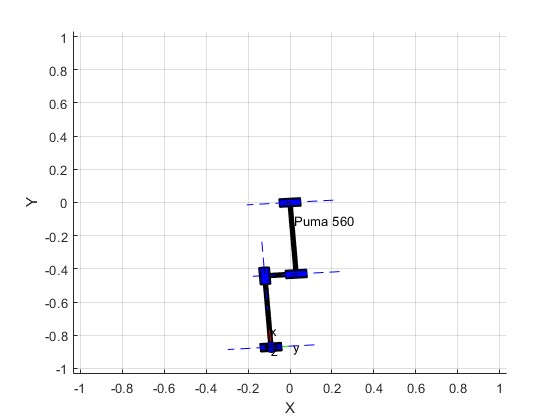
�Ի����˽���ͼ�η��棬����ֱ����ʾ�������˵��˶�������õ����������������Է���������������Ҫ��Ϣ�����ܴ�ͼ���Ͽ�����������һ�����������µ��˶����ɡ��ӷ��������й۲�����˹�����������н�������ܷ������û����˹켣�滮�ȵ���ȷ�Ժͺ����ԣ��Ӷ�Ϊ���߱���ṩ��Ч����֤�ֶΡ�PUMA560 ��е����һ��ʾ�̻����ˡ����������ɶȣ�����6����ת�ع���ģ���˵������硢��������˶������Թ涨����̬���﹤����Χ�ڵ��κ�һ���㡣���������塢��������ʾ�����������֡�
4.����Դ��
....................................................................
figure;
% subplot(121);
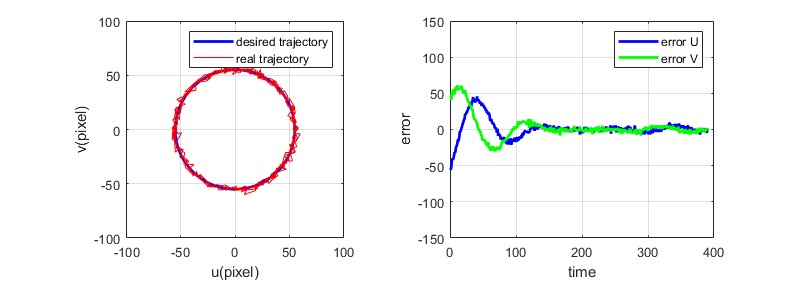
plot(KER*xd1,KER*yd1,'b','linewidth',2);
hold on
plot(KER*X1,KER*Y1,'r');
xlabel('u(pixel)');
ylabel('v(pixel)');
legend('desired trajectory','real trajectory');
axis square;
axis([-100,100,-100,100]);
grid on
% subplot(122);
figure;
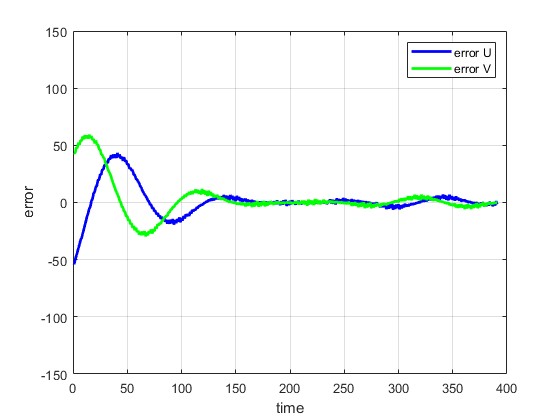
plot(fliplr(KER*X1-KER*xd1),'b','linewidth',2);
hold on
plot(fliplr(KER*Y1-KER*yd1),'g','linewidth',2);
legend('error U','error V');
axis([0,400,-150,150]);
grid on
xlabel('time');
ylabel('error');
%%
%Estimated parameters
[p1,pd1,pdd1] = tpoly(q0(1), q1(1), 400);%�õ�λ�á��ٶȡ����ٶ�
[p2,pd2,pdd2] = tpoly(q0(2), q1(2), 400);%�õ�λ�á��ٶȡ����ٶ�
[p3,pd3,pdd3] = tpoly(q0(3), q1(3), 400);%�õ�λ�á��ٶȡ����ٶ�
[p4,pd4,pdd4] = tpoly(q0(4), q1(4), 400);%�õ�λ�á��ٶȡ����ٶ�
[p5,pd5,pdd5] = tpoly(q0(5), q1(5), 400);%�õ�λ�á��ٶȡ����ٶ�
[p6,pd6,pdd6] = tpoly(q0(6), q1(6), 400);%�õ�λ�á��ٶȡ����ٶ�
figure;
subplot(311);
plot(p1);title('Position');
subplot(312);
plot(pd1);title('Velocity');
subplot(313);
plot(pdd1);title('Acceleration');
dTheta = zeros(11,length(xd1));
Theta = zeros(11,length(xd1));
error = 0.5*(fliplr(KER*Y1-KER*yd1)+fliplr(KER*X1-KER*xd1));
W = zeros(11,length(xd1));
W0 = round(-50*randn(1,11));
for i = 1:length(xd1)
for j = 1:11
W(j,i) = W0(j);
end
end
for i = 1:length(xd1)
for j = 1:11
dTheta(j,i) = abs(error(i))/W(j,i)*exp(1-i/50);
end
end
for j = 1:11
for i = 1:length(xd1)
Theta(j,i) = sum(dTheta(j,1:i));
end
end
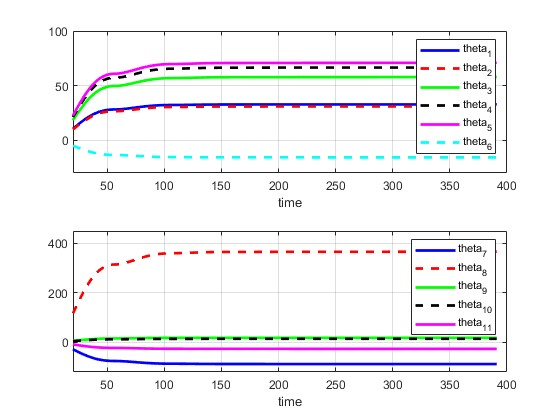
figure;
subplot(211);
plot(Theta(1,:),'b','linewidth',2);
hold on
plot(Theta(2,:),'r--','linewidth',2);
hold on
plot(Theta(3,:),'g','linewidth',2);
hold on
plot(Theta(4,:),'k--','linewidth',2);
hold on
plot(Theta(5,:),'m','linewidth',2);
hold on
plot(Theta(6,:),'c--','linewidth',2);
hold on
grid on
legend('theta_1','theta_2','theta_3','theta_4','theta_5','theta_6');
axis([20,400,-30,100]);
xlabel('time');
subplot(212);
plot(Theta(7,:),'b','linewidth',2);
hold on
plot(Theta(8,:),'r--','linewidth',2);
hold on
plot(Theta(9,:),'g','linewidth',2);
hold on
plot(Theta(10,:),'k--','linewidth',2);
hold on
plot(Theta(11,:),'m','linewidth',2);
hold on
grid on
legend('theta_7','theta_8','theta_9','theta_1_0','theta_1_1');
axis([20,400,-120,450]);
xlabel('time');
08_049_m