


1.完整项目描述和程序获取
>面包多安全交易平台:https://mbd.pub/o/bread/Y5uTmJ5x
>如果链接失效,可以直接打开本站店铺搜索相关店铺:
>如果链接失效,程序调试报错或者项目合作也可以加微信或者QQ联系。
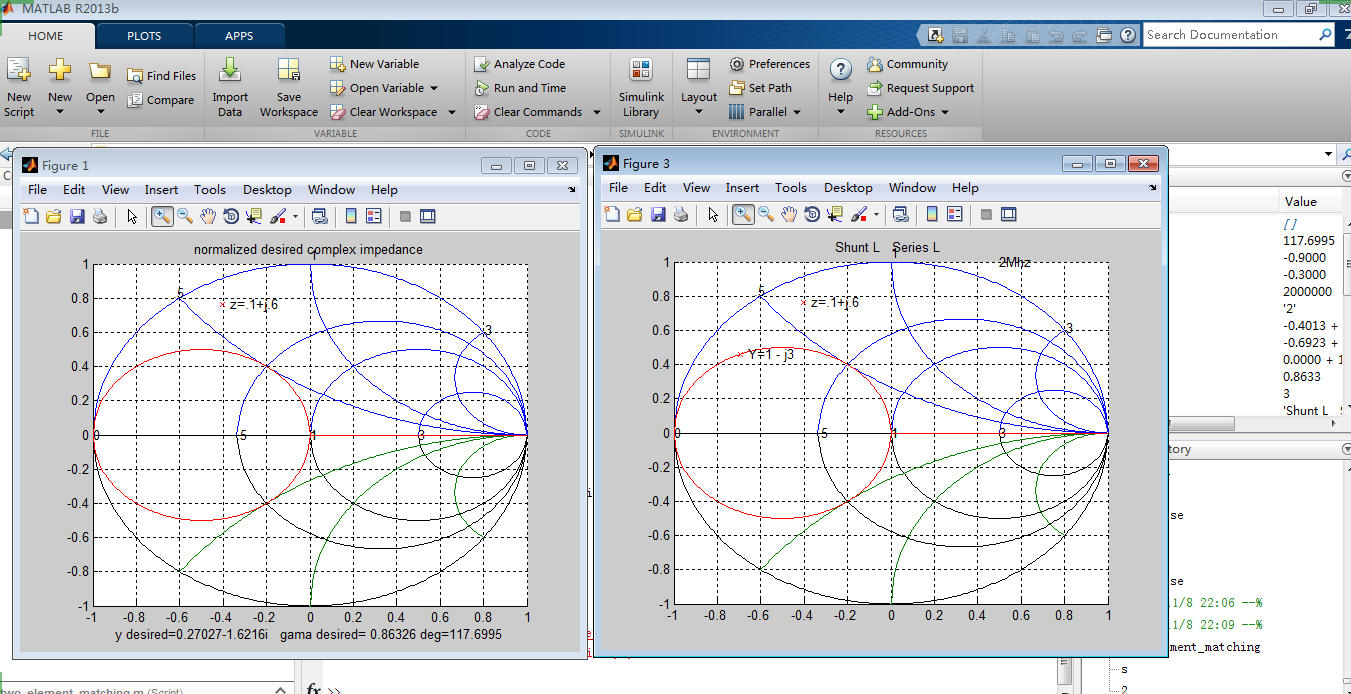
2.部分仿真图预览
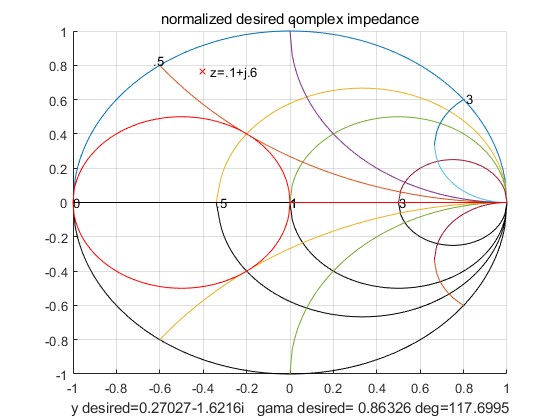
3.算法概述
史密斯图表(Smith chart,又称史密斯圆图)是在反射系散平面上标绘有归一化输入阻抗(或导纳)等值圆族的计算图。是一款用于电机与电子工程学的图表,主要用于传输线的阻抗匹配上。该图由三个圆系构成,用以在传输线和某些波导问题中利用图解法求解,以避免繁琐的运算。一条传输线(transmission line)的电阻抗力(impedance)会随其长度而改变,要设计一套匹配(matching)的线路,需要通过不少繁复的计算程序,史密夫图表的特点便是省略一些计算程序。
4.部分源码
..........................................
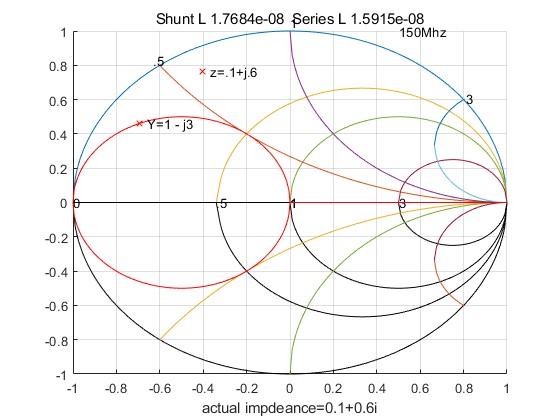
if (deltaZP > 0 & imag(s)==0) % Shunt L Series C zInterceptP
%case1
shuntL=Zo/(s*w)
seriesC=1/(w*abs(deltaZP*Zo))
figure(2)
smith3
gama1=(zInterceptP-1)/(zInterceptP+1) %reflection coeffients of the interscetion to 1+js
t=num2str(s);
s4=[ ' Y=1 - j' t]
plot(gama1,'rx')
text(real(gama1),imag(gama1),s4) %plot intersection point
s1=['Shunt L ' num2str(shuntL) ' Series C ' num2str(seriesC)] %list 2 element match on figure
title(s1)
plot(gama,'rx') %plot desired complex impedance
text(real(gama),imag(gama),s3)
text(.5,1,s5)
%check solution
[zTest]=shuntL_seriesC(shuntL,seriesC,w,Zo)
xlabel(['actual impdeance=' num2str(zTest)])
%*******************************************
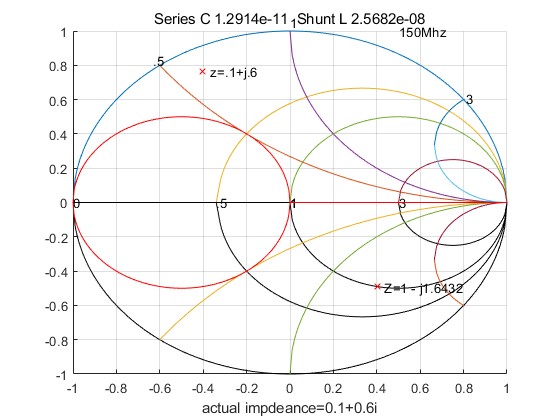
elseif (deltaZP < 0 & imag(s)==0) % Shunt L Series L zInterceptP
%case2
shuntL=Zo/(w*s)
seriesL=abs(deltaZP*Zo)/w
figure(3)
smith3
gama1=(zInterceptP-1)/(zInterceptP+1)
t=num2str(s);
s4=[ ' Y=1 - j' t]
plot(gama1,'rx')
text(real(gama1),imag(gama1),s4)
s1=['Shunt L ' num2str(shuntL) ' Series L ' num2str(seriesL)]
title(s1)
plot(gama,'rx')
text(real(gama),imag(gama),s3)
text(.5,1,s5)
[zTest]=shuntL_seriesL(shuntL,seriesL,w,Zo)
xlabel(['actual impdeance=' num2str(zTest)])
%*******************************************
end
if (deltaZM < 0 & imag(s)==0) % Shunt C Series L zInterceptM
%case3
shuntC=s/(Zo*w)
seriesL=abs(deltaZM*Zo)/w
figure(4)
smith3
gama1=(zInterceptM-1)/(zInterceptM+1)
t=num2str(s);
s4=[ ' Y=1 + j' t]
plot(gama1,'rx')
text(real(gama1),imag(gama1),s4)
s1=['Shunt C ' num2str(shuntC) ' Series L ' num2str(seriesL)]
title(s1)
plot(gama,'rx')
text(real(gama),imag(gama),s3)
text(.5,1,s5)
[zTest]=shuntC_seriesL(shuntC,seriesL,w,Zo)
xlabel(['actual impdeance=' num2str(zTest)])
...................................................
A153