


1.完整项目描述和程序获取
>面包多安全交易平台:https://mbd.pub/o/bread/Y56Vkppv
>如果链接失效,可以直接打开本站店铺搜索相关店铺:
>如果链接失效,程序调试报错或者项目合作也可以加微信或者QQ联系。
2.部分仿真图预览
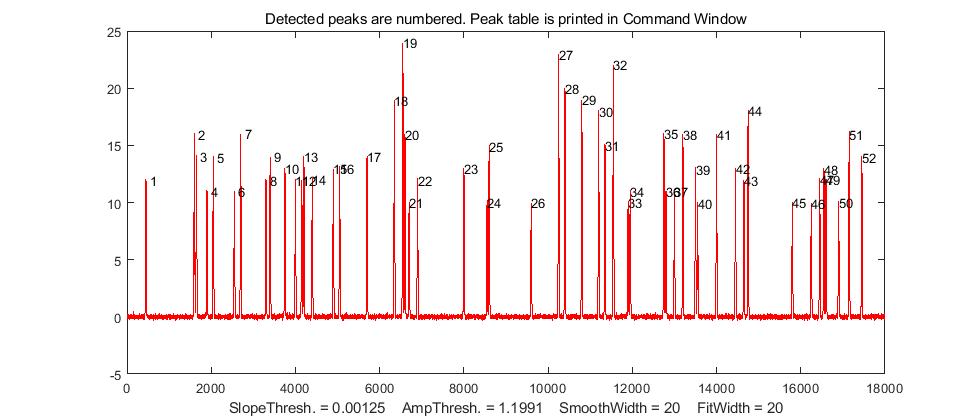
3.算法概述
峰值检验是示波表中数据采集方式之一, 这种技术起源于存储深度不能满足捕获毛刺的需要。如果用模拟示波器去观察, 只有当毛刺信号是重复性的并且和主信号同步时, 才能看到毛刺信号 。由于毛刺源于其他电路系统, 所以这些毛刺只是偶尔发生, 并且和主信号不同步。正常采样方式时, 要捕捉窄的毛刺, 示波表必须将收集到的全部采样数据存储到示波表中, 对于快速扫描, 单次触发就涉及到几千个数据, 而慢速的扫描则需要更大的存储器。峰值检测不像正常采样那样给出一个详细的完整波形显示, 而是以最高的采样率捕捉信号, 简单地忽略某些采样, 只记录发生在每个采样间隔期间内的最大最小的峰值, 这样就不用增加存储深度, 还可以捕捉毛刺或偶发事件。峰值检测是数字示波表的重要技术之一, 主要用来实现波形的毛刺捕捉, 包络的显示以及限制混叠。
4.部分源码
......................................................................
pos=[200:50:17800]; % Positions of the peaks (Change if desired)
amp=round(10.*randn(1,length(pos))); % Amplitudes of the peaks (Change if desired)
wid=20.*ones(size(pos)); % Widths of the peaks (Change if desired)
Noise=.1; % Amount of random noise added to the signal. (Change if desired)
% A = matrix containing one of the unit-amplidude peak in each of its rows
A = zeros(length(pos),length(x));
ActualPeaks=[0 0 0 0 0];
p=1;
for k=1:length(pos)
if amp(k)>9, % Keep only those peaks above a certain amplitude
% Create a series of peaks of different x-positions
A(k,:)=exp(-((x-pos(k))./(0.6005615.*wid(k))).^2); % Gaussian peaks
ActualPeaks(p,:) = [p pos(k) amp(k) wid(k) 1.0646.*amp(k)*wid(k)];
p=p+1;
end;
end
z=amp*A; % Multiplies each row by the corresponding amplitude and adds them up
y=z+Noise.*randn(size(z)); % Adds constant random noise
figure(1);plot(x,y,'r') % Graph the signal in red
% Initial values of variable parameters
WidthPoints=mean(wid)/increment; % Average number of points in half-width of peaks
SlopeThreshold=0.5*WidthPoints^-2; % Formula for estimating value of SlopeThreshold
AmpThreshold=0.05*max(y);
SmoothWidth=round(WidthPoints); % SmoothWidth should be roughly equal the peak width (in points)
FitWidth=round(WidthPoints); % FitWidth should be roughly equal to the peak widths (in points)
% Lavel the x-axis with the parameter values
xlabel(['SlopeThresh. = ' num2str(SlopeThreshold) ' AmpThresh. = ' num2str(AmpThreshold) ' SmoothWidth = ' num2str(SmoothWidth) ' FitWidth = ' num2str(FitWidth) ])
end
A221